Debug Project
From Shoot Em Up Kit
Debug is turned on and off by clicking the ![]() Debug icon on the Tool Bar. When it is on, the icon is green
Debug icon on the Tool Bar. When it is on, the icon is green ![]() .
.
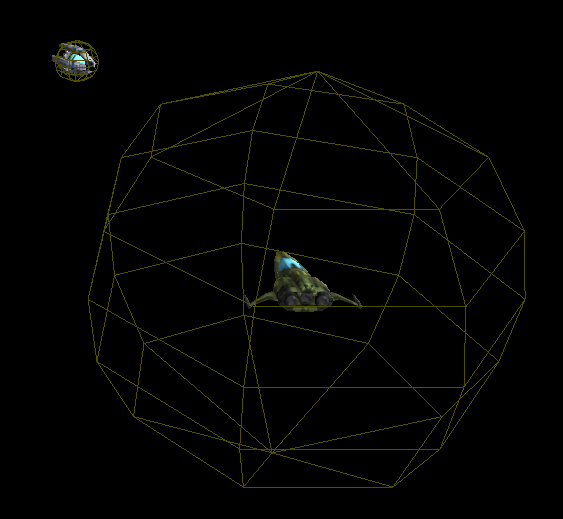
When a game or level is played with Debug on, the collision boundaries of the entities are shown along with Triggers and Active Areas. Objects are taken to have collided when their collision boundaries overlap.
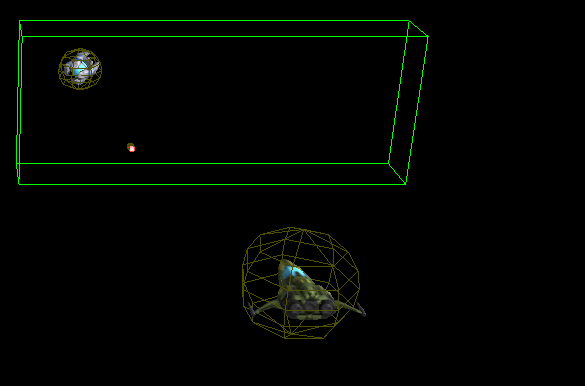
This makes it possible to see how objects are colliding with each other and with triggers. This can help to find the cause if objects are being destroyed unexpectedly. In the example below, the ships are being destroyed as they are colliding because the collision sphere of the lower ship is too large - this can be corrected by selecting the ship in the Entity Editor and going to the Collisions Tab.
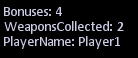
Any Custom Variables in the level will be displayed in the top left corner of the screen as shown:
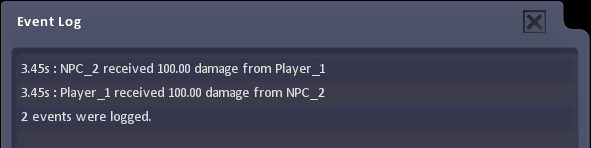
On pressing [ESC] to return to the Editor, an Event Log window is displayed. This shows key information such as collisions, triggers and the destruction of objects.